The net2phone Canada Google Sheets™ add-on is a powerful tool for distilling large amounts of data and quickly downloading and analyzing your call data in a spreadsheet. The Google Sheets™ Sonar add-on still uses Versature branding.

For an introduction to the different reports you can create, check out our Google Sheets™ Add-On - The Basics.
Handling Large Data Sets
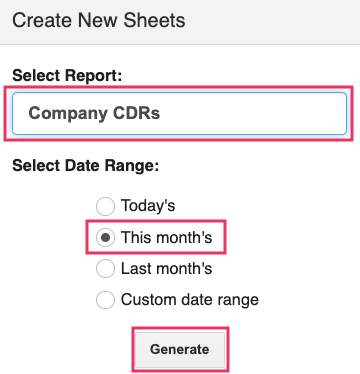
While having instant access to all your call data is useful, the sheer volume can be overwhelming. This guide will show you how to refine the data in your Company Call Detail Records (CDRs) using pivot tables for actionable insights. Only Office Managers can create Company CDRs, while all users can generate personal CDRs.
Caution: Save your Data!
If you create formulas or filters directly to a sheet that has been generated by the net2phone Canada add-on, your changes will NOT be saved if the sheet is refreshed.
Using Pivot Tables
Pivot tables are one of the most efficient ways to summarize large data sets. They offer:
- Quick data summaries
- Easy refresh options for updated reports
- Less manual input compared to formulas
- More accurate results than filters
For a quick tutorial on creating pivot tables in Google Sheets™, check out Google’s support documentation.
Tracking Agent Productivity
At net2phone Canada, we use pivot tables to analyze call data and track the productivity of our client care teams.
What We Want to Know
With our pivot tables, we aim to track:
- Total outbound and inbound calls by each agent
- Total talk time by agent
- Percentage of work hours spent on calls
While the numbers don't necessarily tell the whole story, they can be monitored for trends and create concrete stepping stones for meaningful conversations.
An agent is taking most of the inbound calls, but has the least amount of talk time; this agent could be resolving cases faster, or they could be elevating more calls and handing off cases more readily than other agents.
An agent has significantly lower talk times and call counts; this could be an opportunity to review the agent's behaviour or determine if additional training is required.
At net2phone Canada, typically create two pivot tables:
-
Outbound Calls: Total count + talk time
-
Inbound Calls: Total count + talk time
Creating Pivot Tables
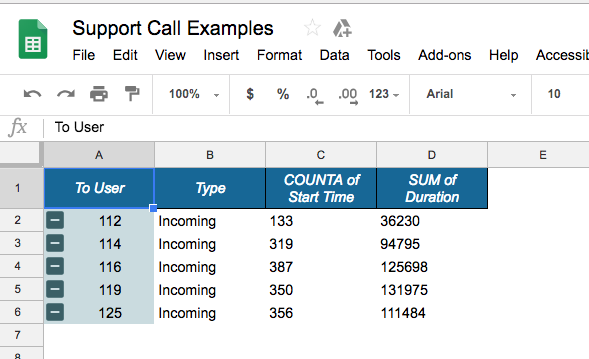
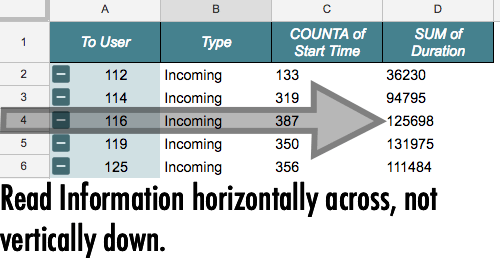
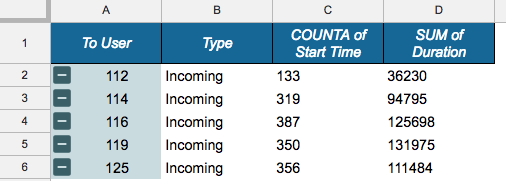
When working with pivot tables, focus on either rows or columns for clarity. For example, while column headings might be “To User” or “Duration,” you’ll primarily read the data horizontally (by rows) based on the user’s extension.
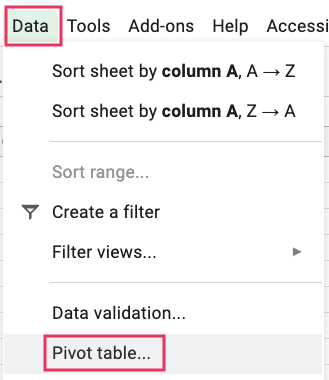
- In a Google Sheet, click the Data dropdown menu.
- Click Pivot Table.
Reading Pivot Tables
In this example, we read the tables through rows, even though the columns are titled—the table's data depends on the users' extensions, which are determined by rows. Although the title categories are displayed as columns, i.e., "To User," you must read the data horizontally through the rows, viewing the user with extension number 116 and a SUM Duration of 125698 minutes.
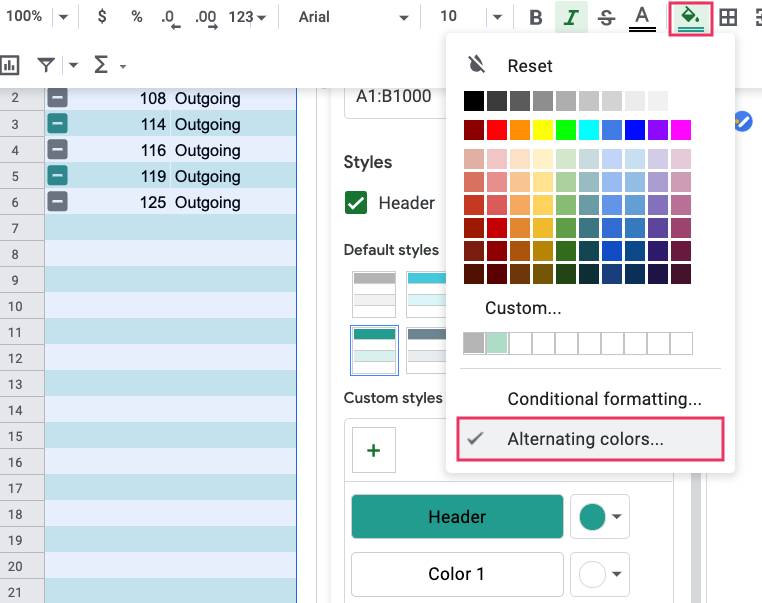
Colour-Code your Tables for Better Readability
Your table should now display outbound call data for the selected users.
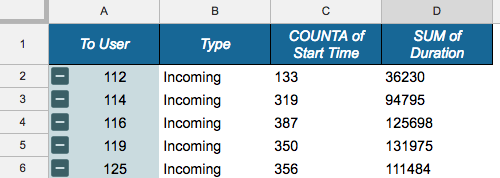
To improve readability, you can format the table by applying alternating row colours using the Fill Color option.
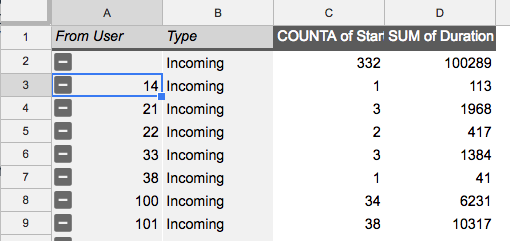
How to Create an Outbound Pivot Table
When examining user extensions, you must create separate inbound and outbound pivot tables. Our pivot table will include outbound calls, the count of start times, and the call duration.
-
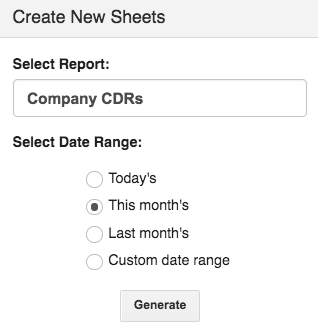
Generate a Company CDR sheet for a specific time period.
- In the Rows section of your pivot table, add:
- From User
-
Type
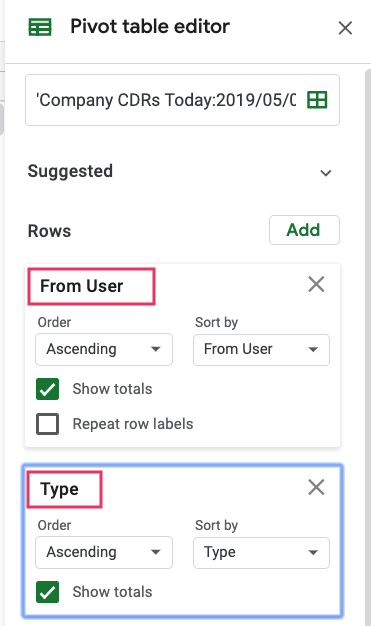
- In the Values section, add:
- Start Time (count of start time)
-
Duration (total call time)
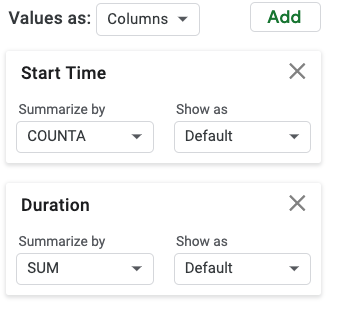
- (Optional) Unselecting “Show totals” makes the table easier to read.
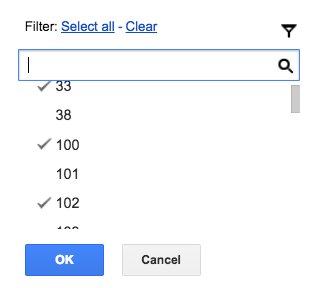
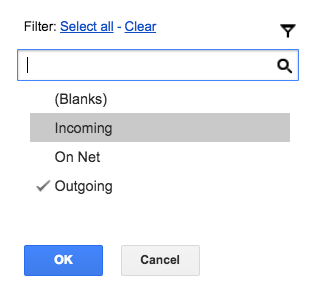
- Refine the data by adding filters:
- Add a From User filter to select specific users.
- Add a Type filter to show only outbound calls.
Creating an Inbound Pivot Table
Follow the same steps as for the Outbound Pivot Table, but with the following adjustments:
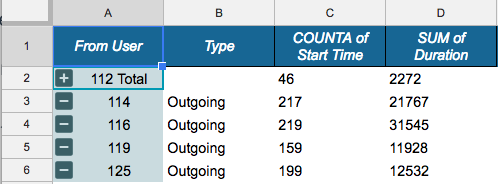
- The inbound pivot table will use To User rather than From User to show calls that the extension answered.
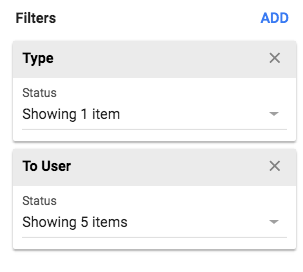
- Add a To User filter rather than a From User at the bottom of your editor.
Next Steps: Creating an Impact Table
Now that both your pivot tables have been created, we can take them to the next level; this will further refine your data for more detailed insights. Learn how to create an Impact Table with some basic formulas.
