Insight Wallboards offers various components to display call data. These components update every minute, except for Agent Presence, which updates in real time. Available component types include:
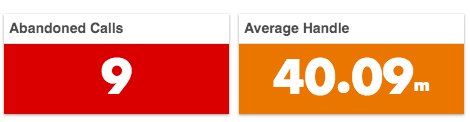
- Value: Displays a single numeric or time-based metric.
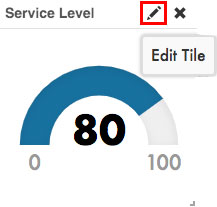
- Gauge: Shows a percentage on a half-circle scale.
- Table: Organizes data into rows and columns for easy comparison.
- Chart: Visualizes data as pie, bar, scatter, or radar charts.
- Text Box: Add additional notes or context to your Wallboard.
- Clock: Displays either an analog or digital clock.
Real-Time Updates and Customization
All Wallboard components update every 60 seconds to keep data current. However, Agent Presence is updated in real-time, providing accurate status information for agents at any given moment.
With flexible design options like drag-and-drop positioning, colour customization, and conditional formatting, you can ensure your Wallboards present data in the most actionable and user-friendly way for your team.
Editing Wallboard Components

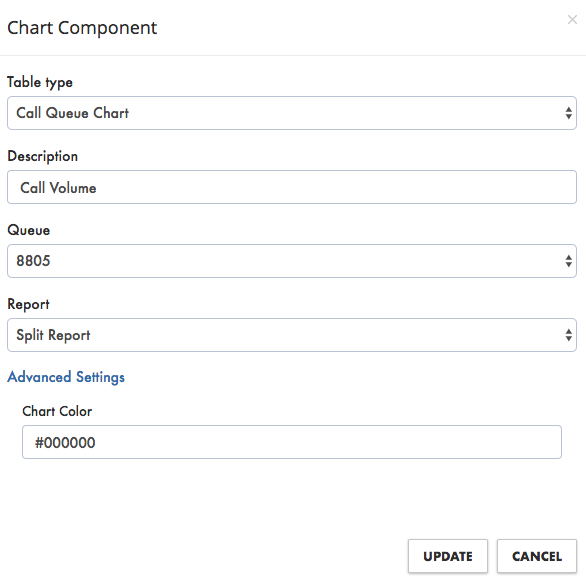
Customizing components is simple. To begin, click the pencil icon in the top-right corner of any component you wish to modify. Each component can be tailored to fit your needs, including adjusting descriptions, queue selection, and data formats.
Customizing Colors and Conditional Formatting
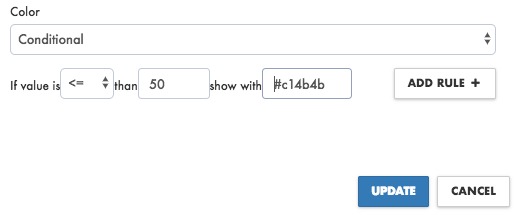
You can apply solid colors or set up conditional formatting for components based on specific data thresholds. Conditional formatting uses comparison rules such as:
- Greater than (>)
- Less than (<)
- Greater than or equal to (>=)
- Less than or equal to (<=)
- Equal to (==)
For example, you can use these rules to adjust color settings for the Average Wait Time component. If the wait time is below 30 seconds, it can appear green; between 30-60 seconds, it turns yellow; and for 60 seconds or more, it changes to red—providing quick visual insight into performance.
Component Type Details
Each component type in Insight Wallboards offers unique ways to visualize your call data, allowing you to tailor your dashboard to meet specific reporting needs and improve decision-making.
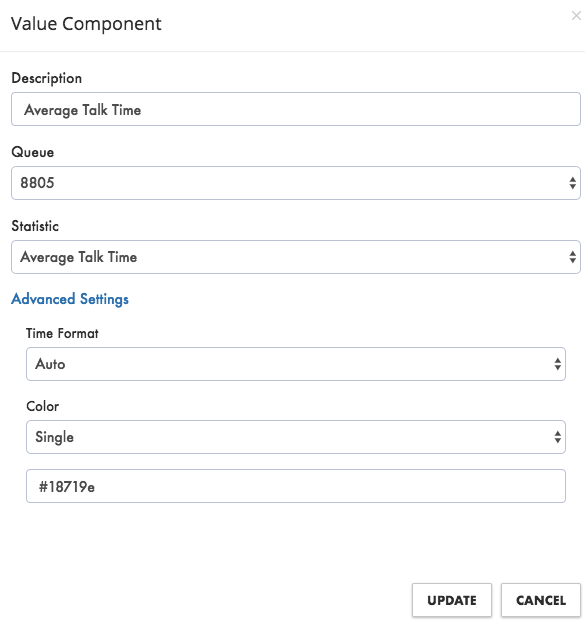
1. Value Components
Value components display a single numeric or time-based measurement, such as the total number of calls or average talk time. You can customize the component’s description, choose which queue and statistic to display, adjust time formats, and set colours.
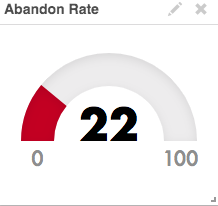
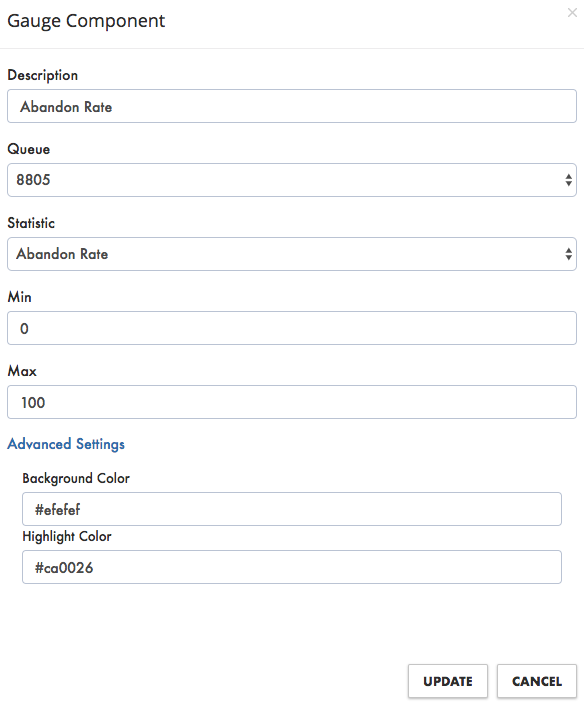
2. Gauge Components
Gauge components show data as a percentage using a half-circle scale, alongside a numeric value. When editing a Gauge, you can modify the description, select the queue and statistic, and set the scale’s minimum and maximum values, as well as the background and highlight colours.
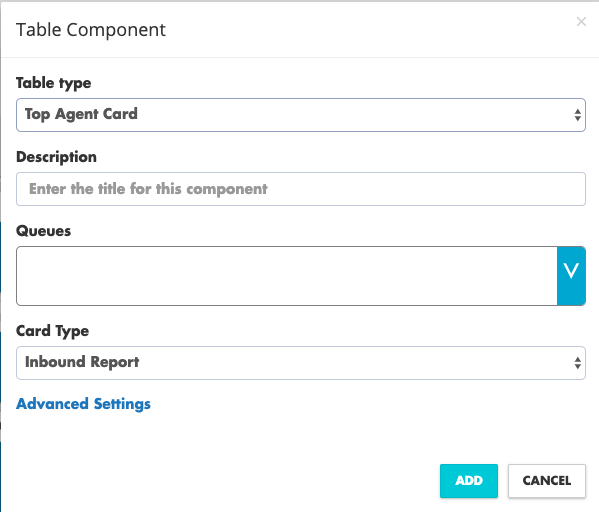
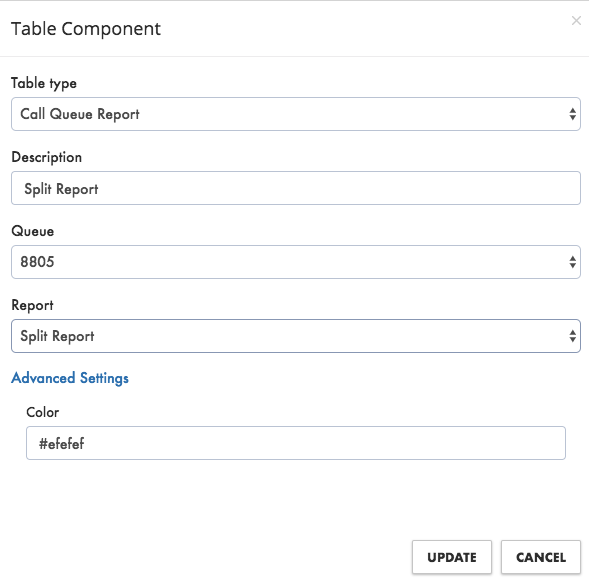
3. Table Components
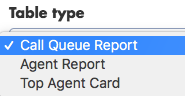
Table components organize data into a structured format. There are multiple table types, including:
- Call Queue Report: Displays performance data for an entire queue.
- Agent Report: Shows individual agent performance in a queue.
- Top Agent Card: Highlights outbound calls and agent activity for the current day, week, or month.
Wallboard Presence also uses colour coding to display real-time agent status:
- Grey: Logged out of the queue.
- Green: Logged in, not on the phone.
- Yellow: On hold or phone ringing.
- Red: On a call.
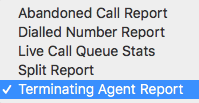
Other available reports include:
- Abandoned Call Report: Shows details of calls abandoned in a queue.
- Live Call Queue Stats: Tracks active calls, available agents, and average wait times.
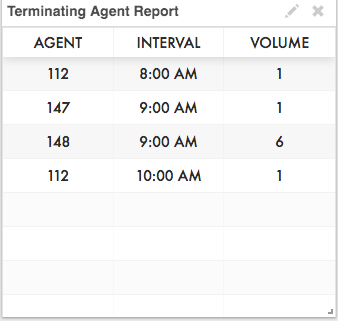
- Terminating Agent Report: Displays call volume by agent, broken down by time intervals.
Abandoned Call Report - includes the date, from the user, queue number, queue name, dialled number, and wait time.
Dialled Number Reports - includes inbound calls with the call volume and number dialled.
Live Call Queue Stats - live queue stats for all queues in your organization.
Active calls - how many calls are currently live in a queue.
Available agents - how many agents are logged into a queue.
Average wait time - the average number of seconds or minutes a caller spent in the selected queue before being dispatched to an agent.
Calls waiting - the number of calls currently waiting to be answered.
Maximum wait time - shows the current longest wait time. If a call is waiting for five minutes, it will go back to zero a minute after that call is answered.
Number of agents - total number of available and unavailable agents.
Queue - queue extension number.
Number of unavailable agents - the number of agents either logged out of the queue or on the phone.

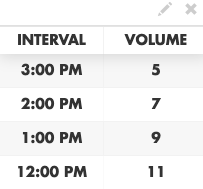
Split Reports - displays a queue's call volume.
Terminating Agent Report - displays the volume of calls taken by a queue's agents (listed by extension number), which is broken down by intervals within a predetermined time period.
4. Chart Components
Chart components visually represent data in various formats.
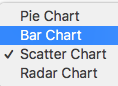
Available chart types include:
- Call Queue Chart: Shows overall performance data for a queue.
- Agent Chart: Focuses on performance data for individual agents.
- Number Monitor: Displays call volume data from a specific number over a set date range.
- Interval Call Stats: Shows call statistics over several days, for inbound or outbound calls.
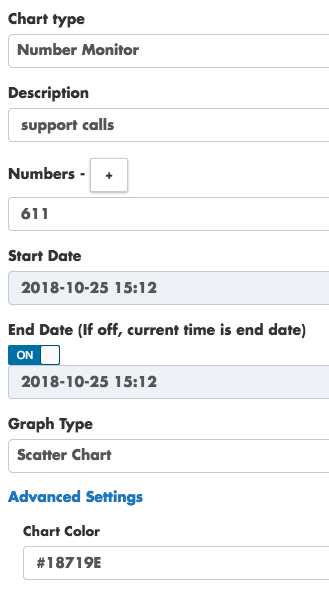
When editing a Chart, you can adjust the description, select the queue and report type, and set the minimum and maximum scale values, along with the component’s colour.
5. Text and Clock Components
To add a Text Box or Clock, scroll through the component options at the top of the screen. The Text Box allows you to provide additional context or notes on your Wallboard, while the Clock offers both analog and digital options for displaying the time in digital or analog format.


Learn more about Performance Wallboards
Check out the full Wallboard user guide here. If you need assistance, contact our Technical Support team by dialling 611 from any net2phone Canada device, or email support@net2phone.ca.
