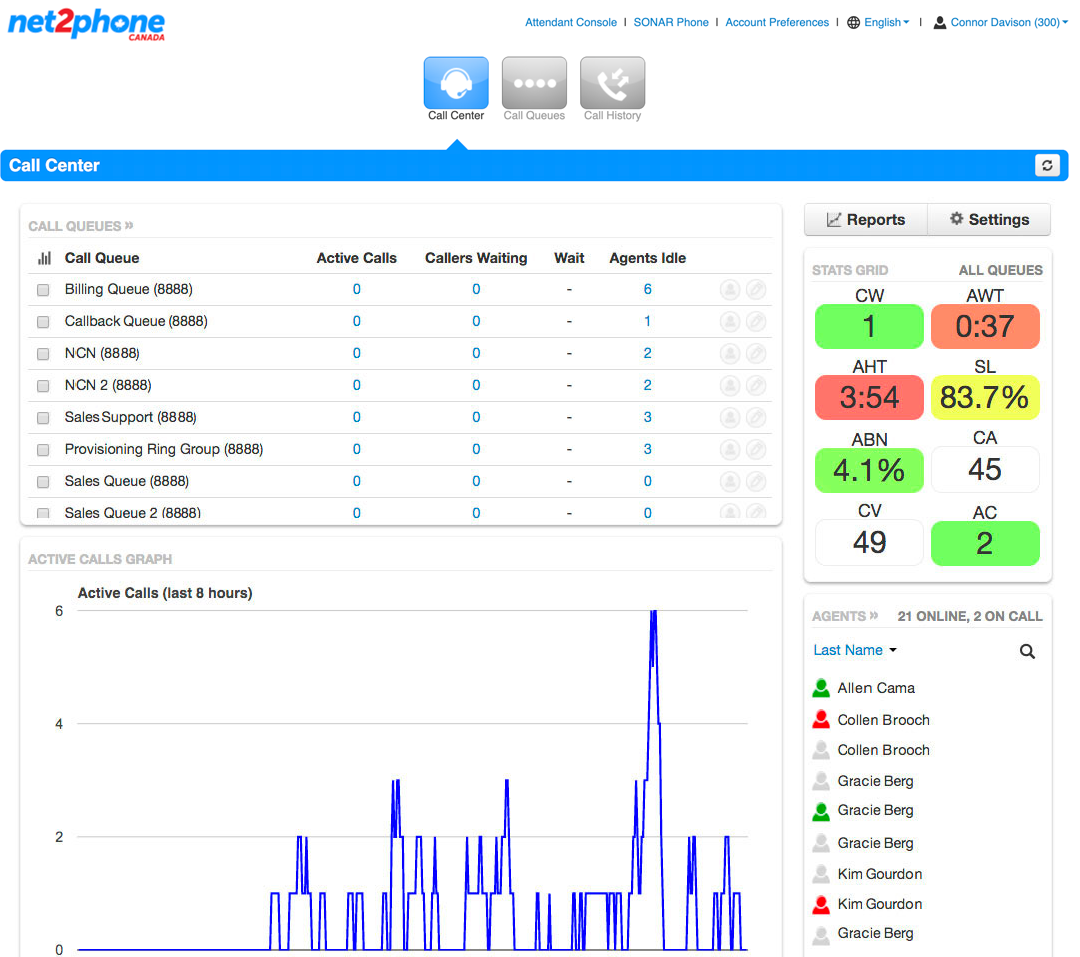
The Call Center section is designed to give you fast access to the most important and frequently viewed information. There are five components of the Call Center section:
- Call Queues
- Active Call Graph
- Reports/ Settings
- Stats Grid
- Agents
Accessing your Call Center in Sonar
You must be in Manage Organization/Manage Call Center to access the Call Queues tab.
Office Manager View
Except for the image below, all examples in this article use a Call Center Supervisor account. Office Managers will see more tabs (users, auto attendants, music on hold, etc.) than the three (call center, call queues, call history) available to a Call Center Supervisor.

- Log in to the Sonar portal with Call Center Supervisor or Office Manager credentials.
- Click the Call Center tab.
Call Queues
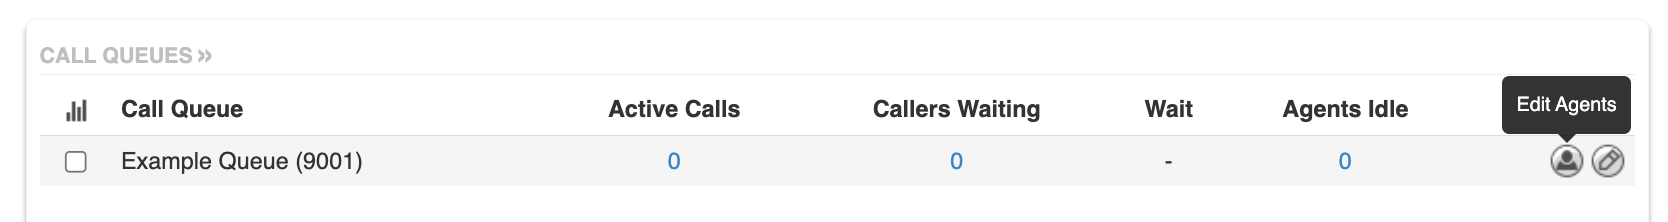
The Call Queues section shows all queues associated with your call center, including the number of active calls, caller wait times, and idle agents for each queue. The agent and edit icons on the right allow you to edit agents and queue settings.

Each queue has a checkbox before the queue name that allows you to select which queues you want to include in the Active Calls Graph and Stats Grid. If none of the queues are selected, information from all the queues is included.
Statistics available in this view
Active Calls – Number of callers talking to an agent.
Callers Waiting – Number of callers in a queue waiting for an available agent.
Wait – The average wait time in the queue before being dispatched to an agent; this field recalculates the average each time a call is answered or an additional caller enters the queue. If the queue becomes empty, this field resets.
Agents Idle – Number of agents who are logged in, but are not currently on a call.
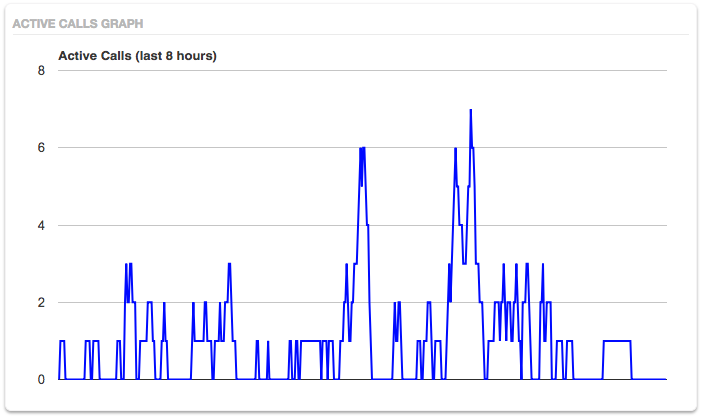
Active Call Graph
The Active Call Graph illustrates the volume of active calls at any point over the last 8 hours. By default, it includes all the queues. If you want the graph to include specific queues, you can select one or more in the above section by clicking the checkbox beside the queue name.
Reports and Settings
Reports and Settings are located on the right side of the page, above the Stats Grid.
Reports

You can access all of the available reports by clicking the Reports button above the Live Stats grid. Within the reports window, you have the ability to configure graphs based on your needs. You can control the time, date, and report type using the calendar or the drop-down menus.
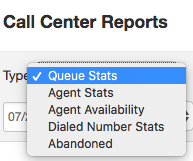
There are 5 types of stats and graphs you can choose from:
- Queue Stats
- Agent Stats
- Agent Available
- Dialled Number Stats
- Abandoned
Call Queue Report Notes
Reports use statistic acronyms, if you're unfamiliar with an acronym, check out the Call Center Statistic Glossary.
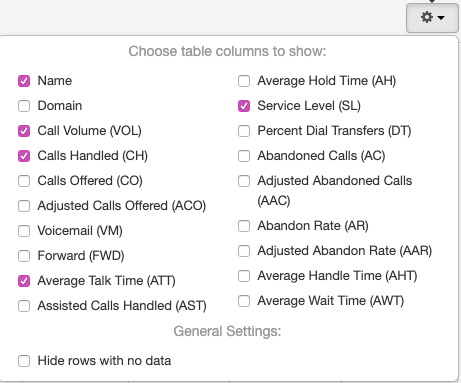
To access the different stat options, you must change the Stats report type and click the gear icon on the right side.

Queue Stats and Dialed Number Stats
The default stats included are:
- Name
- Domain
- Call Volume (VOL)
- Calls Handled (CH)
- Average Talk Time (ATT)
- Average Handle Time (AHT)
- Abandoned Calls (AC)
- Service Level (SL)
But you can choose to display any of the following:
- Calls Offered (CO)
- Adjusted Calls Offered (ACO)
- Voicemail (VM)
- Forward (FWD)
- Assisted Calls Handled (AST)
- Average Hold Time (AH)
- Percent Dial Transfers (DT)
- Adjusted Abandoned Calls (AAC)
- Abandoned Rate (AR)
- Adjusted Abandoned Rate (AAR)
- Adjusted Wait Time (AWT)
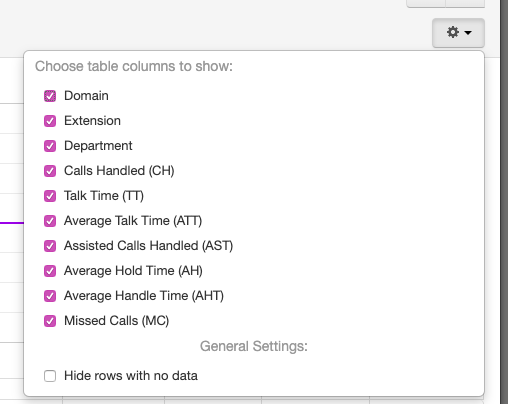
Agent Stats
The default stats included are:
- Call Volume
- Average Talk Time (min)
But you can choose to display any of the following:
- Domain
- Extension
- Department
- Calls Handled (CH)
- Talk Time (TT)
- Assisted Calls Handled (AST)
- Average Hold Time (AH)
- Average Handle Time (AHT)
- Missed Calls (MC)
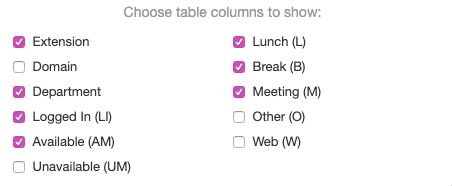
Agent Availability Stats
The default stats included are:
- Extension
- Department
- Logged in (LI)
- Available (AM)
- Lunch (L)
- Break (B)
- Meeting (M)
But you can choose to display any of the following:
- Domain
- Unavailable (UM)
- Other (O)
- Web (W)
Call Center Statistic Notes
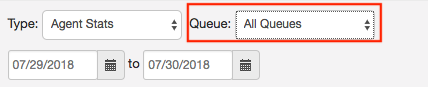
For Agent Stats, Dialed Number Stats and Abandoned Stats, the information in the table is compiled for all the queues in the account. If you want to focus the number on one specific queue, you can select which one from the drop-down as shown below.
You can download or print any reports using the download and print icon buttons on the top right side.

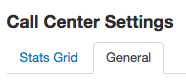
Settings

Within the settings window, you can access two tabs: the Stats Grid tab and the General tab.
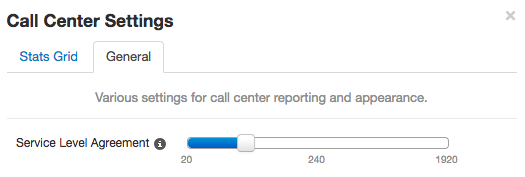
The General Tab
This access point allows you to adjust your Service Level Agreement (SLA). Your SLA determines if a call is answered in an acceptable amount of time, which is measured in seconds. The default SLA is 60 seconds.
The Stats Grid Tab
This access tab allows you to choose which statistics will appear in your Stats Grid. If you choose to have a statistic displayed, you can enter the lower and upper thresholds to enable colour warnings with green, yellow, and red. If you choose not to enter a lower threshold, the warning colour will turn yellow when 70% of the upper threshold is reached.
Green - The displayed statistic is less than the lower threshold.
Yellow - The displayed statistic is greater than the lower threshold but less than the upper threshold.
Red - The displayed statistic is greater than the upper threshold.
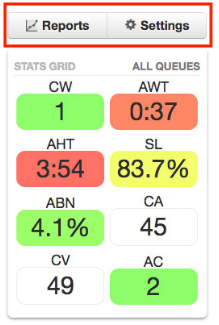
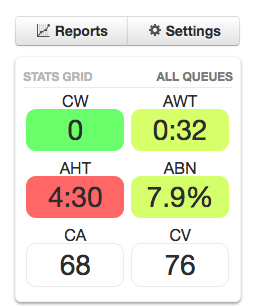
The statistic options you can preview in the Stats Grid are:
Callers waiting (CW) - the number of callers that are currently in the queue.
Average wait time (AWT) - the average duration a caller is waiting in the queue before it is answered or abandoned.
Average handle time (AHT) - the average time it takes agents to complete a call.
Service level (SL) - the percentage of calls meeting the configurable service level agreement.
Abandon rate (ABN) - the percentage of calls that went unanswered.
Calls answered (CA) - total calls answered.
Call volume (CV) - total calls that were dispatched to the queue.
Abandoned calls - total number of calls that went unanswered.

Stats Grid
The Stats Grid is located directly under the reports and settings buttons. If you want to filter stats based on specific queues, you can click the checkbox next to the queue name under the Call Queues section, as explained above in this article. If no queues are checked, the statistics will show all the call queues.
Agents
The Agents section quickly shows which users are or aren't available in queues, if they are available (green), on a call (red) or not logged in (grey).

When hovering over an agent 2 buttons are available:

- Stats
- Queues
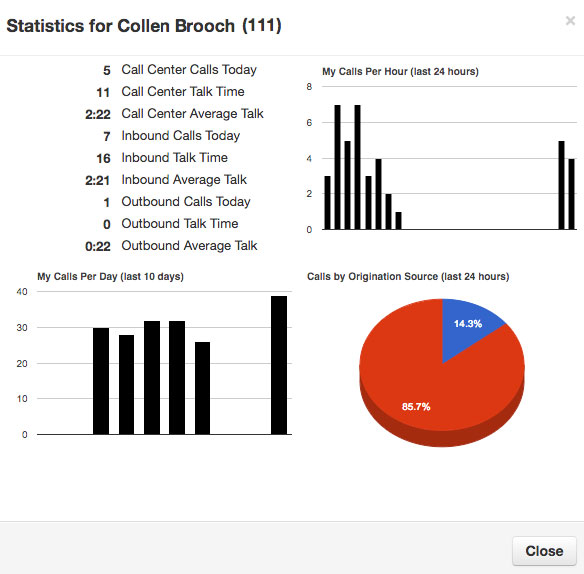
Agent Stats
Individual agent statistics are displayed in the same format as the "My Statistics" section of the Call Center tab while in the "My Account" view. This section displays data in three graphs: My Calls Per Day (for the last 10 days), My Calls Per Hour (for the last 24 hours), and Call by Organization Source (for the last 24 hours).
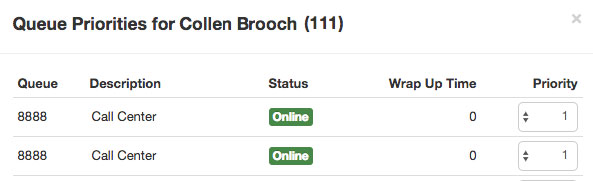
Agent Queues
The queues section lists all the queues assigned to an agent. The information listed includes the queue number, the queue description or name, the agent's current status for a queue, their wrap-up time, and the queue's priority to the agent.