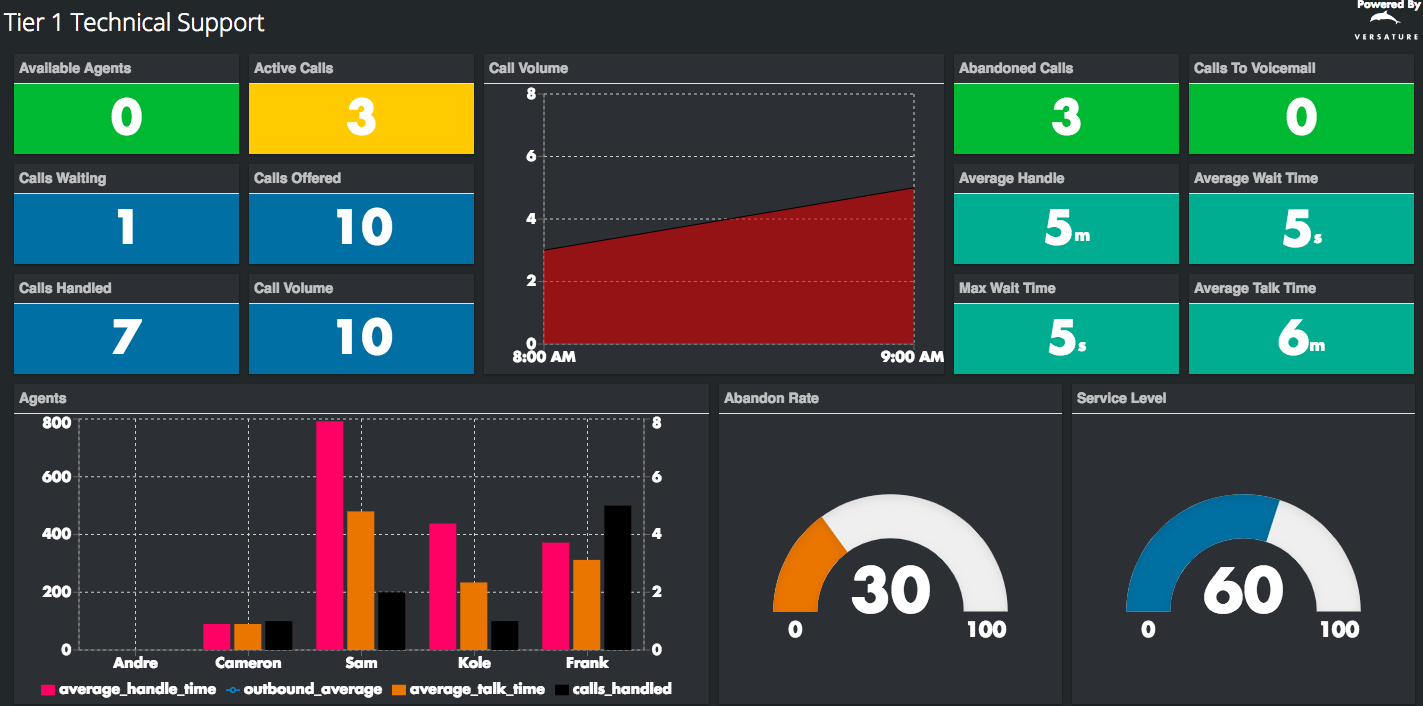
Sonar Wallboards provide a visual representation of call data using various component types. Wallboard metrics update every minute, making it easier for managers and supervisors to stay up-to-date with call center performance. Enjoy your finished board on either large screens or small monitors; Wallboards offer flexibility in display options.
Wallboard Key Features
Insights Performance Wallboards create a culture of high performance.
- Updated every minute to ensure real-time data visibility.
- Include agent and queue stats (inbound/outbound).
- Offer four component options: gauge, value, table, chart, as well as a textbox and clock.
- Drag-and-drop functionality for ease of customization.
- No additional software is required for screen display.
Wallboard Access Requirements
Insights Wallboards is a premium net2phone Canada bundle feature. If you don’t have access or are unsure, contact our Technical Support team for assistance. Dial 611 from any net2phone Canada device or email support@net2phone.ca.
Who can create and edit Wallboards?
Office Managers and Call Center Supervisors can edit Wallboards through the Insights portal,
Who can view Wallboards via URL?
Basic Users and Call Center Agents can access them via URLs managers share.

Navigating the Wallboard Section
Within the Wallboard section in your Insights portal, you'll find an interactive table of all the Wallboards you’ve created.
Quickly identify key information:
- The name of the Wallboard.
- Last modified date and the person who made the changes.
- Privacy settings (public/private).
- Demo mode status (use fake data to preview the layout).
- Dark or light mode setting for better visibility.
- Present: Get URL to Share

On the right side, you can search for a Wallboard, toggle the Wallboard table between list and board views, and add new wallboards.

Wallboard Settings
Within the Performance Wallboard configuration page, you can find 6 buttons, directly under your profile.

Refresh
While in editing mode the Wallboard will not automatically refresh its numbers. You must manually refresh if you want to see updated figures.
Delete
You cannot undo this action. A warning message appears to confirm you want to delete a Wallboard.


Additional Options
The Additional Options button gives access to more Wallboard options without cluttering your editing screen.
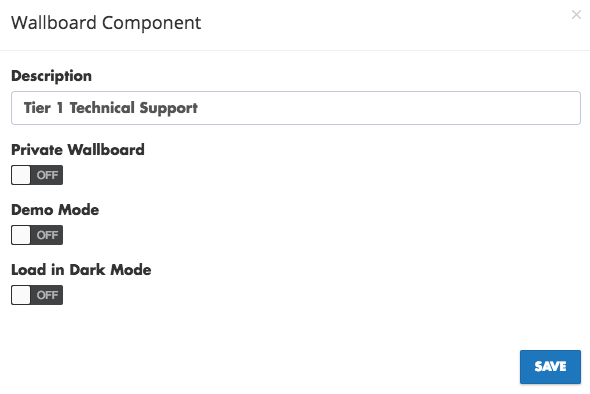
Description – You can easily change the name of your Wallboard. Remember that the name is shown at the top of the screen, even in presentation mode.
Private Wallboard – You always share Wallboards via URL accessed by the "Get Link to Share" button. Private Wallboards require the recipient to enter their net2phone Canada credentials before they can see any statistics and data.
Demo Mode – demo mode populates your Wallboard with fake data so you can see how your graphs and charts look once they're live. Keeping demo mode off displays your current data.
Load in Dark Mode – preselect if you want your Wallboard to have a white or black background, as shown in the section below.
Using Drag-and-Drop for Layout Customization
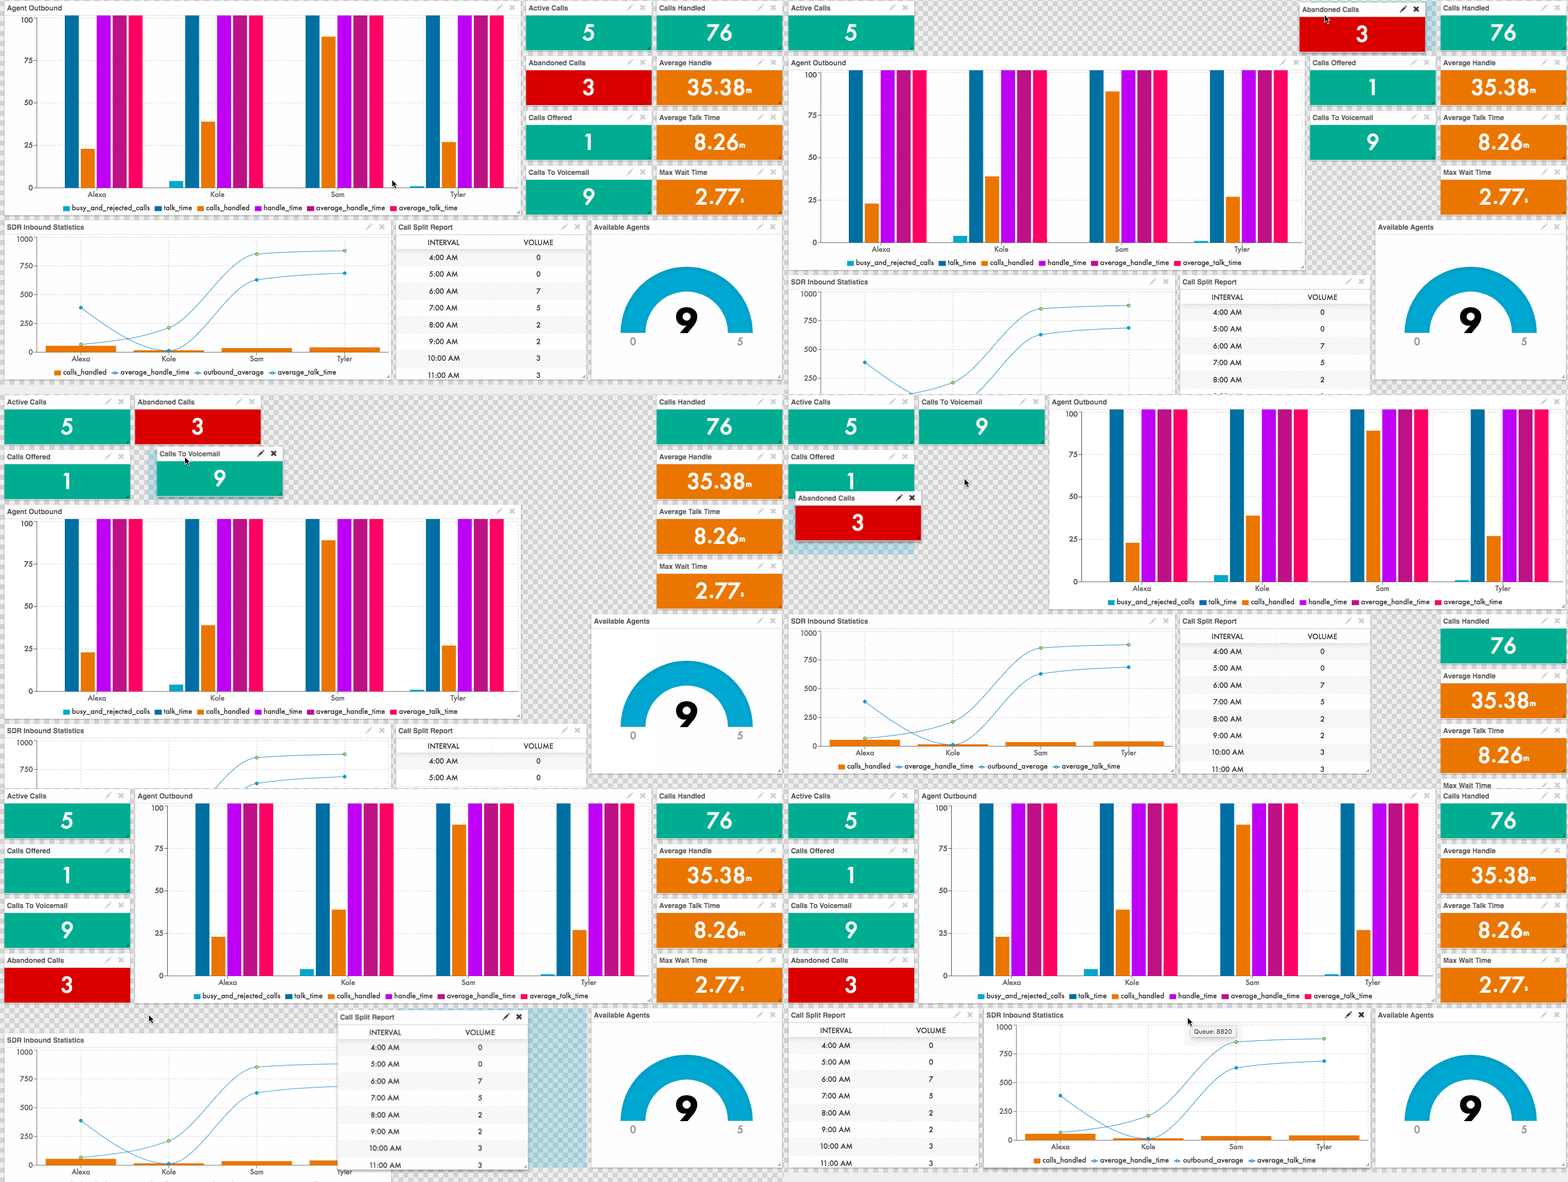
You can easily reposition components by clicking, holding, and dragging them around your Wallboard. The transparent background indicates that you are in editing mode.
Light and Dark Themes
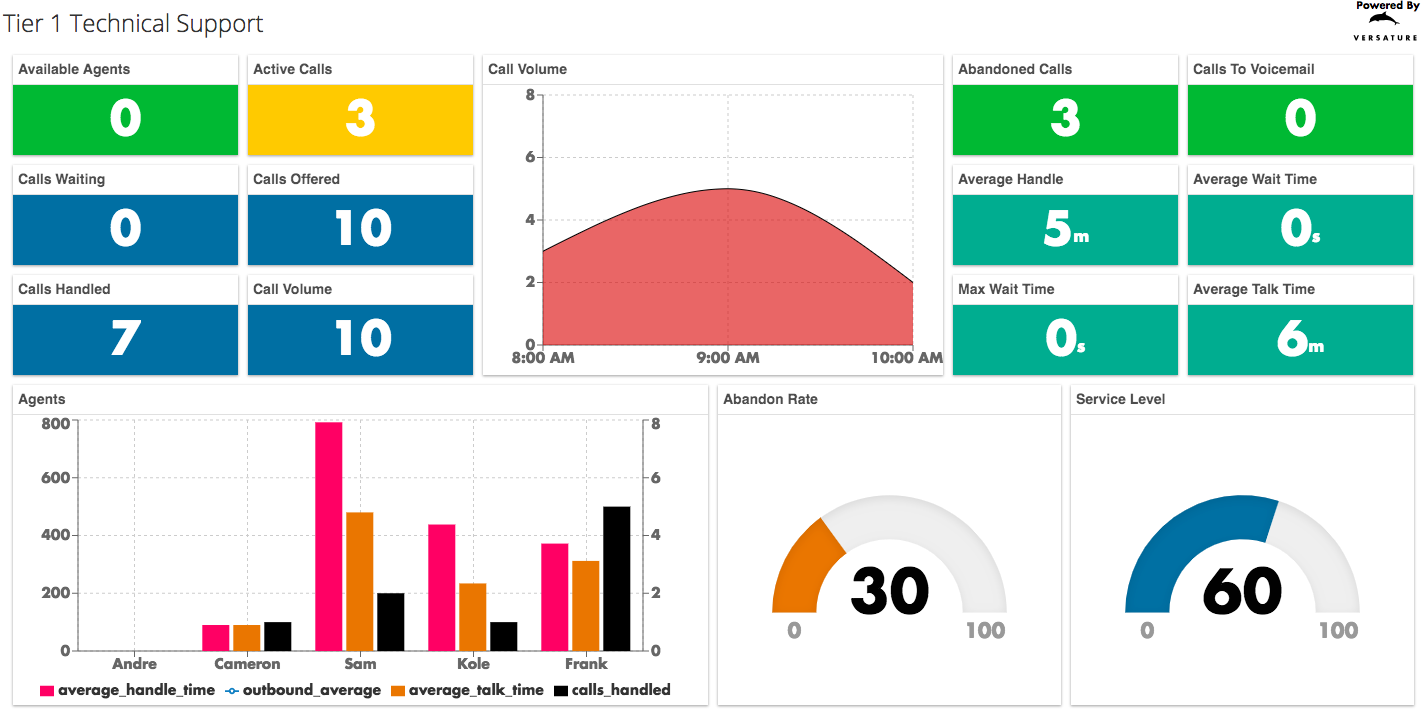
Once shared, Wallboards can toggle between light (white) and dark (black) themes. A theme switch icon is available in the top-right corner for easy access.
Create and Edit Sonar Wallboards
Wallboards allow endless customization options, whether you're tracking multiple call queues or focusing on specific performance metrics. Office managers are the only users authorized to create and edit Wallboards.
How to Add a New Performance Wallboard
There is no limit to the number of Wallboards you can create: the customization is endless!
- Log in to the Sonar Insights portal with Office Manager credentials.
- Click Performance Wallboards.

From here, you can edit a previously created Wallboards, or create a new one. - Click New Wallboard.

- Choose a Wallboard Type.
- Service Template
- Executive Template
- Sales Template
- Enter a Description for your Wallboard.
- Choose the Call Queue you want to track.
- Click Create.
Edit Wallboards
The editing page has many options, so you can track exactly what data is relevant to your needs.
Wallboard Component Types
Insight Wallboards offer various components to display call data. These components update every minute, except for Agent Presence, which updates in real time. Available component types include:
- Value – Displays a single number or time.
- Gauge – Shows a percentage using a half-circle scale.
- Table – Organizes data in rows and columns.
- Chart – Presents data in pie, bar, scatter, or radar formats.
- Text Box – Add notes or context.
- Clock – Analog or digital clock options.
Check out this article for a full list of Wallboard components.
Editing and Customizing Components
To edit any component,
- Click the pencil icon in the top-right corner.
- Configure the input data such as:
- descriptions,
- data sources,
- colours, and,
- additional formatting (for example, a Gauge component has minimum and maximum values for the scale and customizable background colours).
- Adjust the component size and placement on your board using the drag-and-drop user interface.


